Sending out Storm metrics
There are a few posts talking about Storm's metrics mechanism, among which you can find Michael Noll's post, Jason Trost's post and the storm-metrics-statsd github project, and last but not least (or is it?) Storm's documentation.
While all of the above provide a decent amount of information, and one is definitely encouraged to read them all before proceeding, it feels like in order to get the full picture one needs to combine them all, and even then a few bits and pieces are left missing. It is these missing bits I'll be rambling about in this post.
storm-metrics-statsd is a nice starter, it builds reasonable metric names and sends them to Statsd. The thing is, it heavily relies on the concept of statsd counters to do the per-metric aggregations. If your bolt has X tasks, and each of these X tasks reports an aggregate metric such as execute-count, in order to get the total number of executions per bolt you'll need to sum it all up. To avoid summing it up for yourself, you can create a counter and report individual counts, the counter will sum things up for you, that is exactly the approach storm-metrics-statsd has adopted.
If all your metrics are integers, that could work great, but things start to go sideways when you're dealing with non integer metrics, or non-aggregate metrics, i.e., metrics that don't accumulate over time, like latency for instance. This is where storm-metrics-statsd requires some tweaking.
Finally, while storm-metrics-statsd provides a nice template, my goal is to report metrics directly to Graphite using Yammer metrics API, without taking the Statsd detour. Both Statsd and Yammer API have the notion of counters and gauges so what's to come should apply for both Statsd and Yammer to the best of my knowledge.
Reporting non-integer and/or gauge based metrics
To make things work we'll need to move from cozy counters to the somewhat more laborious gauges, which is like all things in life - a trade off. We're trading the auto summation for aggregate metrics we mentioned earlier for the ability to report non-integer metrics and non accumulative metric types.
In order to address the fact gauges do not sum things for us, so we'll have to do the summation after the reporting stage, in Graphite. To be able to do that, we need to change storm-metrics-statsd's "host-port-componentId" reporting to a "host-port-componentId-taskId" granularity, since different taskIds for the same worker-host-componentId will overwrite each other's values, bad for us.
Reporting bolt's capacity
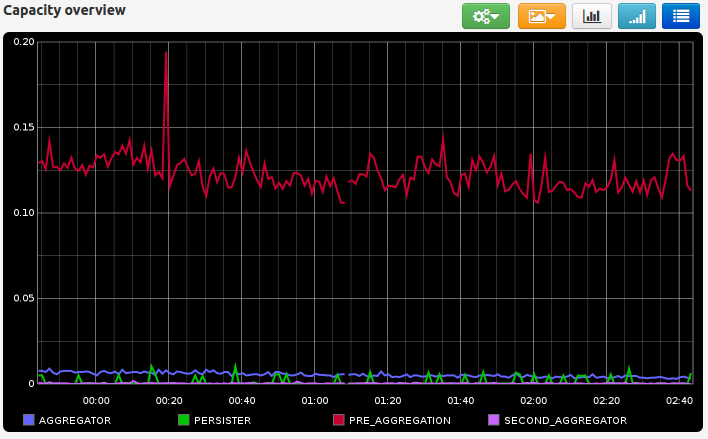
A particular metric that turned out to be a pain to report was the bolt capacity. This metric is showed by the Storm UI for 10min time windows, but is not sent directly as a metric to the metric consumer API. The API reports the two sub metrics based on which capacity can be computed, the executed-count metric, and the execute-latency metric. While the formula is pretty straight forward: execute-count * average-latency / time-window-ms, few things should be considered.
- Empirically inspecting stuff, it appears time-window-ms should be scaled by the number of executors running a particular bolt's tasks.
- Computing the capacity using the formula above using Graphite is pure hell. Don't try this at home, or do, but know that you're in for a treat.
All of which has brought me to the conclusion capacity is best computed in code, and reported as a separate metric. Another thing to worth noting here, is that this is made possible due to the fact I'm running with a parallelism hint = 1 for my metric consumer, which guarantees that all metrics arrive at the same metric consumer instance. I'm not sure this is the case if parallelism hint > 1 as this depends on the shuffleGroupping of the metrics bolt, which I gave up on figuring out after digging into the Storm's Clojure sources. At some point I just felt this syntax might make me sick, plus I had just eaten. Basically, if the execute-count and execute-latency metrics for a particular taskId don't arrive at the same metric consumer instance, you can't compute the capacity for that particular taskId.
These thoughts have brought me to create storm-metrics-reporter, so if you're into reporting Storm metrics to Graphite, or some other metrics system, take a look, you might find it useful.


Comments
Post a Comment